Our values were
| NT (mm) | beta HCG (MoM) | PAPP-A (MoM) |
| 2.9 | 1.733 | 0.973 |
and
| CRL (mm) | BPD (mm) | ductus venosus PI |
| 73.5 | 25.4 | 1.20 |
This lead to adjusted risks for Down syndrome (trisomy 21), Edwards syndrome (trisomy 18), and Patau syndrome (trisomy 13) given by
| classification | background risk | adjusted risk |
| trisomy 21 | 1:165 | 1:101 |
| trisomy 18 | 1:421 | 1:3074 |
| trisomy 13 | 1:1317 | 1:3991 |
https://fetalmedicine.org/calculator/trisomies
The results for the risk aren't exactly the same as the ones we received at the hospital because the data one can input on the website doesn't include some of the data used in the sonographer's calculation (for example, ductus venosus PI and BPD are not included in the web calculator), but in our case the results were reasonably close anyhow.
In order to understand better what our risk means we have used a number of resources. First we wanted to check in what centile our NT measurement of 2.9 mm belongs. For this purpose we used the website:
In order to understand better what our risk means we have used a number of resources. First we wanted to check in what centile our NT measurement of 2.9 mm belongs. For this purpose we used the website:
and entered our measurements for CRL and NT (note NT increases with CRL in the first trimester until around 14 weeks). The result we obtained was that our NT is in the 96th centile for our given CRL.
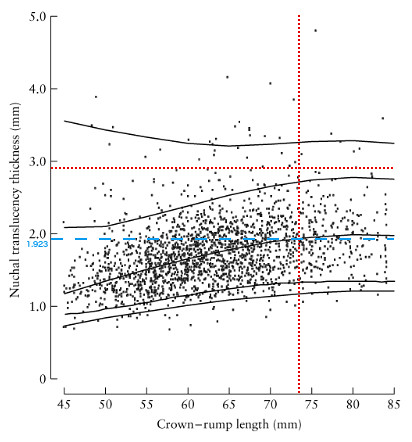 The centile can be checked, to some degree, by determining where our result lies within a plot of non-trisomy 21 data for NT vs. CRL from [2] (right). In this plot the 1%, 5%, 50%, 95%, and 99% curves are included. Our values of NT and CRL are given by the intersection of the dotted red lines. This intersection lies in between the 95th and 99th centile curves, which is not inconsistent with the 96th percentile result we obtained from perinatology.com.
To further understand the risk associated with our particular NT value, we consider a plot of the frequency in down and non-down syndrome pregnancies of a range of NT deviation. To determine our value of the NT deviation we also include the dashed blue line in the figure to obtain the median value of the NT (1.923 mm) at our value of the CRL (73.5 mm).
The nuchal translucency deviation can then be obtained obtained using
NT deviation = [your NT] - [median NT at your CRL]
Our NT deviation is therefore 0.977 mm. We consider a figure from the Fetal Medicine Foundation manual [1] of the frequency of occurrence of a range of values of the NT deviation in down and non-down syndrome pregnancies, which we have modified to indicate our data.
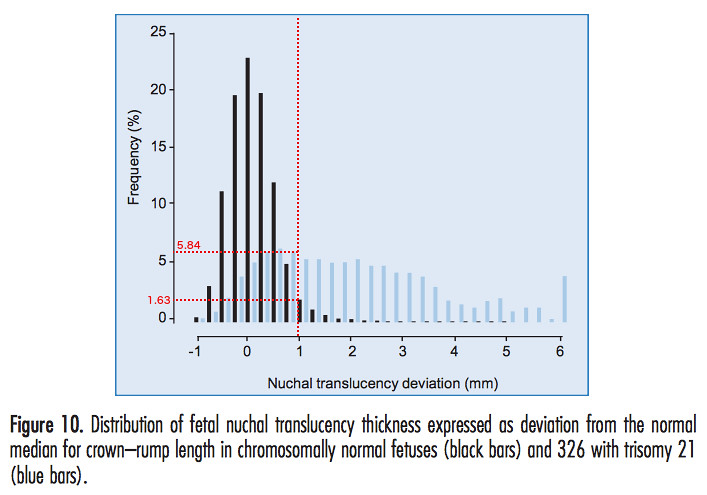
The vertical red dotted line represents our value of the NT deviation. The horizontal red dotted lines are drawn in to estimate the frequencies of occurrence of our NT deviation in non-down and down syndrome pregnancies. We find that the frequency of occurrence of our particular NT deviation in non-down syndrome pregnancies is around 1.63%. In down syndrome pregnancies our NT value has a frequency of around 5.84%. By adding up the frequencies of NT deviations lying to the right of our value for non-down syndrome pregnancies, it would appear from this figure that we are closer to the 97th or even 98th percentile.
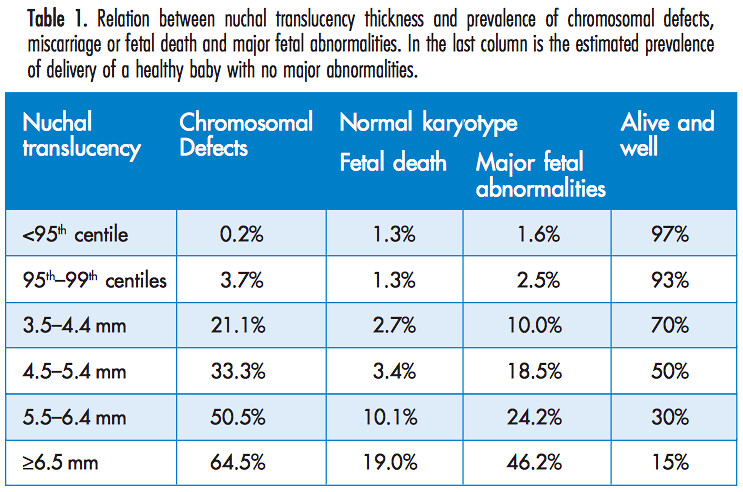
Given that our NT value is between the 95th and 99th percentile, we can use a table in the manual [1] from the Fetal Medicine Foundation
The centile can be checked, to some degree, by determining where our result lies within a plot of non-trisomy 21 data for NT vs. CRL from [2] (right). In this plot the 1%, 5%, 50%, 95%, and 99% curves are included. Our values of NT and CRL are given by the intersection of the dotted red lines. This intersection lies in between the 95th and 99th centile curves, which is not inconsistent with the 96th percentile result we obtained from perinatology.com.To further understand the risk associated with our particular NT value, we consider a plot of the frequency in down and non-down syndrome pregnancies of a range of NT deviation. To determine our value of the NT deviation we also include the dashed blue line in the figure to obtain the median value of the NT (1.923 mm) at our value of the CRL (73.5 mm).
The nuchal translucency deviation can then be obtained obtained using
NT deviation = [your NT] - [median NT at your CRL]
Our NT deviation is therefore 0.977 mm. We consider a figure from the Fetal Medicine Foundation manual [1] of the frequency of occurrence of a range of values of the NT deviation in down and non-down syndrome pregnancies, which we have modified to indicate our data.
The vertical red dotted line represents our value of the NT deviation. The horizontal red dotted lines are drawn in to estimate the frequencies of occurrence of our NT deviation in non-down and down syndrome pregnancies. We find that the frequency of occurrence of our particular NT deviation in non-down syndrome pregnancies is around 1.63%. In down syndrome pregnancies our NT value has a frequency of around 5.84%. By adding up the frequencies of NT deviations lying to the right of our value for non-down syndrome pregnancies, it would appear from this figure that we are closer to the 97th or even 98th percentile.
Given that our NT value is between the 95th and 99th percentile, we can use a table in the manual [1] from the Fetal Medicine Foundation
to determine the probability of a chromosome defect from the NT measurement alone. This shows that baby's risk for chromosomal defects, based on NT measurement alone, is around 3.7%. Being told this would have been a massive comfort for us.
Our specific likelihood ratio for a down syndrome pregnancy can be estimated from another figure in [1].
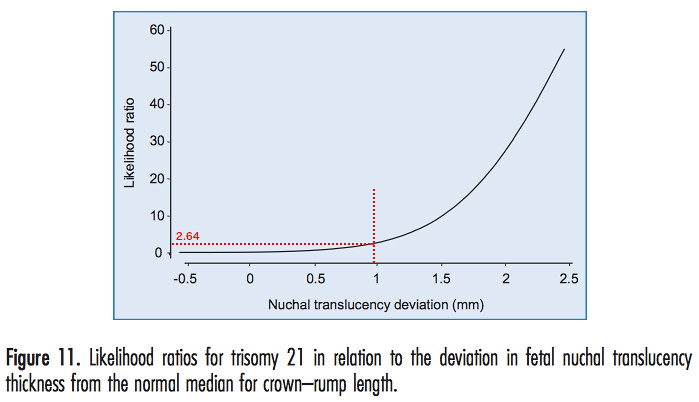
We have added the red dotted lines to estimate the likelihood ratio from our specific NT deviation, which turned out to be 2.64%.
Unfortunately my blood test results also add to the risk. To see where our results for HCG and PAPP-A lie relative to what is expected for people who have a trisomy 21 pregnancy and those who don't we used a figure from [3].
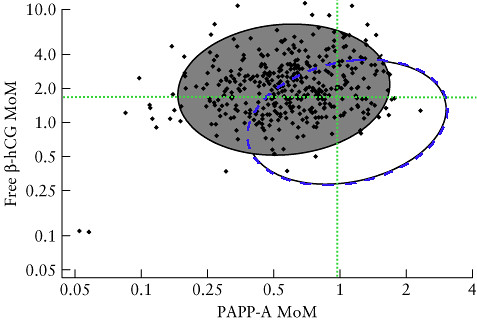
Here the gray filled ellipse includes 90% of the values of HCG and PAPP-A in trisomy 21 pregnancies (the data are the black points). The open ellipse includes 90% of the values of HCG and PAPP-A in non-trisomy 21 pregnancies (data points not included in fig). The blue dashed line running along the circumference of the open ellipse is our addition so we can see the area enclosed by the intersection of the two ellipses. The green dotted lines intersect at our specific values of HCG and PAPP-A. Given this result, it is clear that our blood data falls in the intersection area, making it consistent with both a trisomy 21 pregnancy, and a non-trisomy 21 pregnancy.
One thing to note about this kind of plot, is that there are many more data points corresponding to non-trisomy 21 pregnancies (which aren't shown for clarity) compared to trisomy 21 pregnancies. This means that even in the intersection region where it looks like it could go either way, it's much more likely to be a non-trisomy 21 pregnancy, even close to the edge of the open ellipse, simply because trisomy 21 pregnancies are rare in comparison. However, one would need to show both the trisomy 21 data and the non-trisomy data to make a proper assessment. At any rate, since both the NT measurement and the blood results are consistent with either a trisomy 21 pregnancy, or a non-trisomy 21 pregnancy, it is useful to look at the other data from the scan.
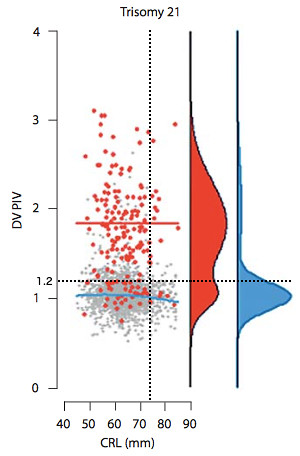 The ductus venosus PI measurement can also be compared to data from trisomy 21 and non-trisomy 21 pregnancies. To this end we consider a figure (left) from [4] of the ductus venosus PI for veins (DV PIV) vs CRL, which we have adapted to include the black dotted lines which indicate our results. The blue line represents the DV PIV value at which the probability distribution of the non-trisomy 21 data (shown in blue to far right of plot) has a maximum. The red line represents the maximum of the probability distribution of the trisomy 21 data (shown in red to the right).
While our value of DV PI does not lie at the peak of the probability distribution for either the trisomy 21 or non-trisomy 21 data, it is within a range of values which is consistent with either case. If we consider averages it is probably closer to the average of the non-trisomy 21 data, but given the double peak nature of the trisomy 21 distribution it is difficult to make the argument based on proximity to the averages that our data fits with the non-trisomy 21 data better. The one aspect which clearly favours a non-trisomy 21 pregnancy is the fact that there are so many more non-trisomy 21 data points at our value of the DV PI than trisomy 21 data points.
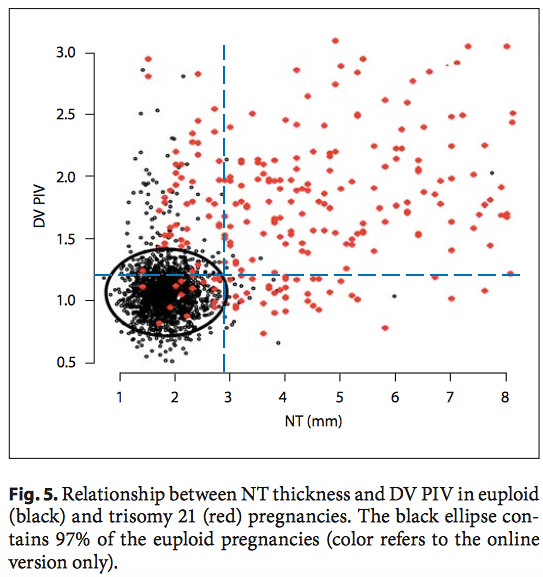 Another useful plot is the DV PIV vs. NT for down and non-down syndrome pregnancies from the same paper [4] (right). The black data points represent the non-trisomy 21 data. The red data points are the trisomy 21 data. The black ellipse includes 97% of the non-trisomy 21 data points, and excludes 91.1% of the trisomy 21 data points. The blue dashed lines are drawn in to indicate our values of the DV PI and NT.
Our results lie just outside the 97% ellipse for non-down pregnancies and just inside the region which contains 91.1% of the trisomy 21 pregnancies. It is our NT value which is more significant here in drawing our result outside the ellipse. However, in this border region our data is still not inconsistent with a non-trisomy 21 pregnancy.
At this point, while we cannot obtain a definitive conclusion from our analysis, we can say that no specific result appears to put us at a higher risk for a down syndrome pregnancy, than a non-down pregnancy. We have opted to take the NIPT non-invasive blood test, which claims to be able to identify 99% of down syndrome pregnancies. We are supposed to receive the results within 10 business days.
Update: at 8 business days we received a phone call with our results. Our baby is low risk for trisomy 13, 18, and down syndrome. While we are still left wondering what has caused the larger than usual NT, this news does mostly clear us from a down syndrome pregnancy. One might ask if I regret having this scan in the first place because of the stress it has placed on us. I don't. In addition to the analysis carried out to create this post, I have also gained a deeper awareness of what down syndrome is. It's knowledge worth having.
[1] http://www.fetalmedicine.com/synced/fmf/FMF-English.pdf (p. 45, 28, 28, 72)
[2] http://onlinelibrary.wiley.com/doi/10.1002/uog.5299/full (Fig. 2)
[3] http://onlinelibrary.wiley.com/doi/10.1002/uog.5331/full (Fig. 2)
[4] http://www.fetalmedicine.com/synced/fmf/21_08_2012_02.pdf (Fig. 2, 5)
Our specific likelihood ratio for a down syndrome pregnancy can be estimated from another figure in [1].
We have added the red dotted lines to estimate the likelihood ratio from our specific NT deviation, which turned out to be 2.64%.
Unfortunately my blood test results also add to the risk. To see where our results for HCG and PAPP-A lie relative to what is expected for people who have a trisomy 21 pregnancy and those who don't we used a figure from [3].
Here the gray filled ellipse includes 90% of the values of HCG and PAPP-A in trisomy 21 pregnancies (the data are the black points). The open ellipse includes 90% of the values of HCG and PAPP-A in non-trisomy 21 pregnancies (data points not included in fig). The blue dashed line running along the circumference of the open ellipse is our addition so we can see the area enclosed by the intersection of the two ellipses. The green dotted lines intersect at our specific values of HCG and PAPP-A. Given this result, it is clear that our blood data falls in the intersection area, making it consistent with both a trisomy 21 pregnancy, and a non-trisomy 21 pregnancy.
One thing to note about this kind of plot, is that there are many more data points corresponding to non-trisomy 21 pregnancies (which aren't shown for clarity) compared to trisomy 21 pregnancies. This means that even in the intersection region where it looks like it could go either way, it's much more likely to be a non-trisomy 21 pregnancy, even close to the edge of the open ellipse, simply because trisomy 21 pregnancies are rare in comparison. However, one would need to show both the trisomy 21 data and the non-trisomy data to make a proper assessment. At any rate, since both the NT measurement and the blood results are consistent with either a trisomy 21 pregnancy, or a non-trisomy 21 pregnancy, it is useful to look at the other data from the scan.
The ductus venosus PI measurement can also be compared to data from trisomy 21 and non-trisomy 21 pregnancies. To this end we consider a figure (left) from [4] of the ductus venosus PI for veins (DV PIV) vs CRL, which we have adapted to include the black dotted lines which indicate our results. The blue line represents the DV PIV value at which the probability distribution of the non-trisomy 21 data (shown in blue to far right of plot) has a maximum. The red line represents the maximum of the probability distribution of the trisomy 21 data (shown in red to the right).While our value of DV PI does not lie at the peak of the probability distribution for either the trisomy 21 or non-trisomy 21 data, it is within a range of values which is consistent with either case. If we consider averages it is probably closer to the average of the non-trisomy 21 data, but given the double peak nature of the trisomy 21 distribution it is difficult to make the argument based on proximity to the averages that our data fits with the non-trisomy 21 data better. The one aspect which clearly favours a non-trisomy 21 pregnancy is the fact that there are so many more non-trisomy 21 data points at our value of the DV PI than trisomy 21 data points.
Another useful plot is the DV PIV vs. NT for down and non-down syndrome pregnancies from the same paper [4] (right). The black data points represent the non-trisomy 21 data. The red data points are the trisomy 21 data. The black ellipse includes 97% of the non-trisomy 21 data points, and excludes 91.1% of the trisomy 21 data points. The blue dashed lines are drawn in to indicate our values of the DV PI and NT.Our results lie just outside the 97% ellipse for non-down pregnancies and just inside the region which contains 91.1% of the trisomy 21 pregnancies. It is our NT value which is more significant here in drawing our result outside the ellipse. However, in this border region our data is still not inconsistent with a non-trisomy 21 pregnancy.
At this point, while we cannot obtain a definitive conclusion from our analysis, we can say that no specific result appears to put us at a higher risk for a down syndrome pregnancy, than a non-down pregnancy. We have opted to take the NIPT non-invasive blood test, which claims to be able to identify 99% of down syndrome pregnancies. We are supposed to receive the results within 10 business days.
Update: at 8 business days we received a phone call with our results. Our baby is low risk for trisomy 13, 18, and down syndrome. While we are still left wondering what has caused the larger than usual NT, this news does mostly clear us from a down syndrome pregnancy. One might ask if I regret having this scan in the first place because of the stress it has placed on us. I don't. In addition to the analysis carried out to create this post, I have also gained a deeper awareness of what down syndrome is. It's knowledge worth having.
[1] http://www.fetalmedicine.com/synced/fmf/FMF-English.pdf (p. 45, 28, 28, 72)
[2] http://onlinelibrary.wiley.com/doi/10.1002/uog.5299/full (Fig. 2)
[3] http://onlinelibrary.wiley.com/doi/10.1002/uog.5331/full (Fig. 2)
[4] http://www.fetalmedicine.com/synced/fmf/21_08_2012_02.pdf (Fig. 2, 5)